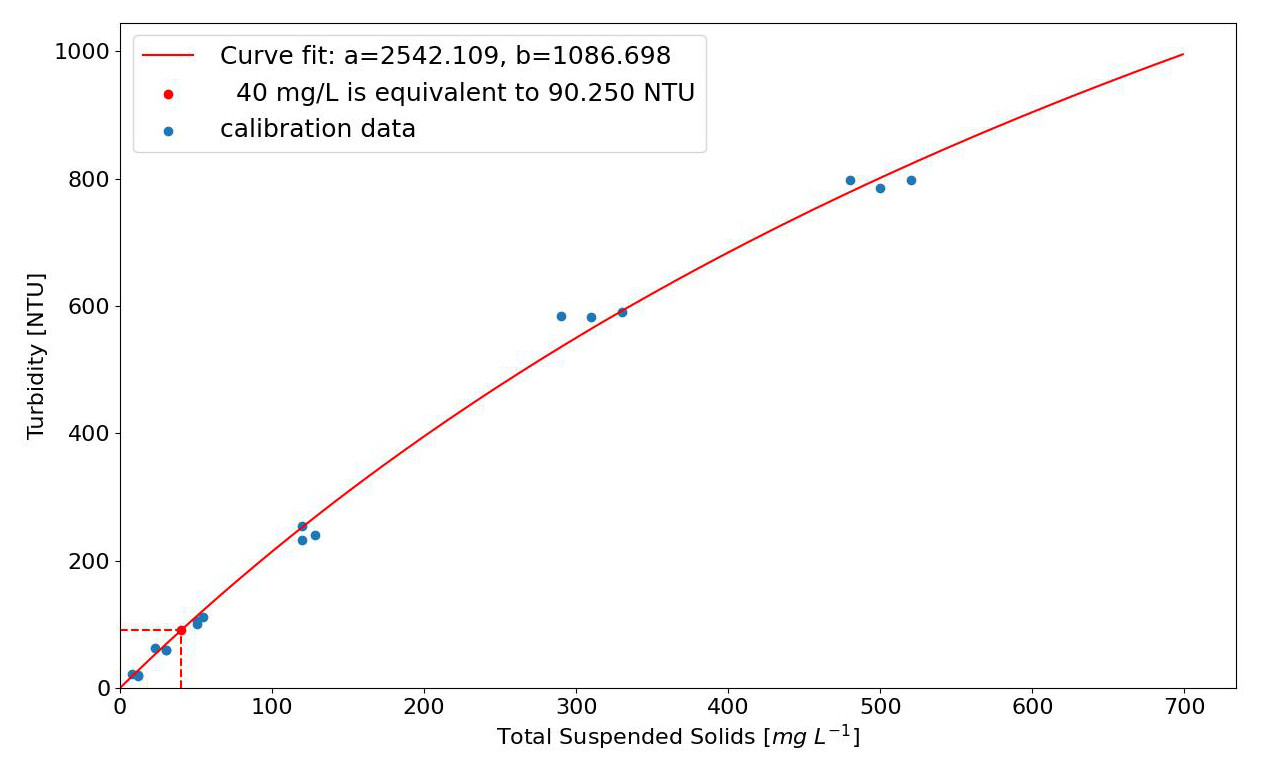
A number of correlations are produced at Nereis Bioengineering. These can be divided into correlations associated with the development and deployment of telemetry equipment and site-specifc correlations produced that relate Total Suspended Solids (TSS) to the measured Turbidity (NTU). The following information primarily concerns the production of TSS-NTU correlations for samples from an individual site. For prices and details of how to get a TSS-NTU correlation for a site contact Frog Environmental using this link who handle all enquires for processing.
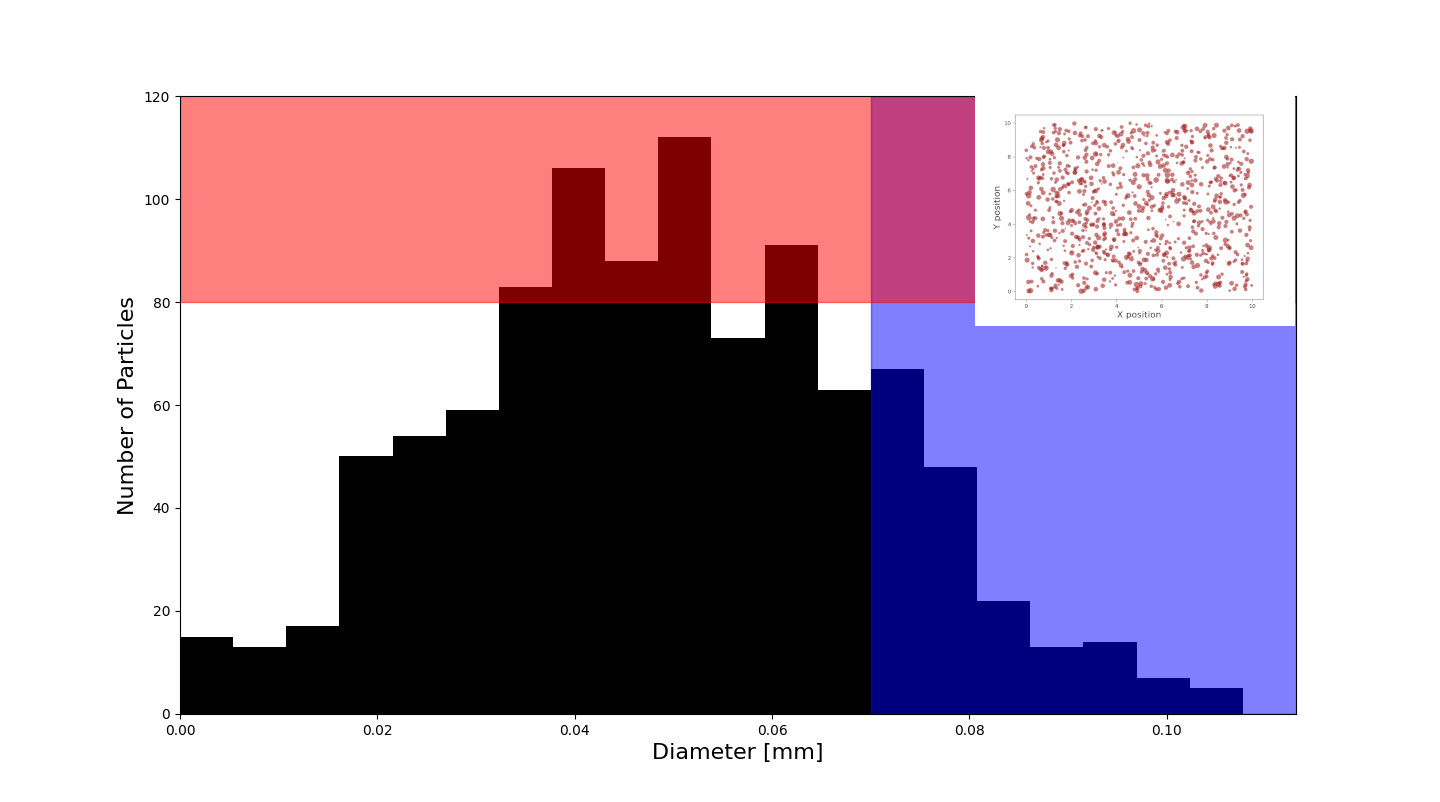
To put these correlations into perspective, the relationships discussed here are limited in the TSS and NTU range in that anything over 1000 NTU is considered a breach of any regulatory TSS value (which can be defended easily when consulting the data available). All TSS values that exceed the range of analysis are also considered to exceed any regulatory value and are also not considered. The regulatory limit defined restricts the analysis to a relatively small range of TSS and NTU values (<1000NTU) to better reflect the relationship where a typically regulatory limit is defined. General regulatory limts are 40 mgL-1 but can be as low as 25 mgL-1 or as high as 100mgL-1. In practice, this means that any non-linear saturation curve representation (see above) calculated is valid for a limited range of TSS and NTU values. In terms of a sample from a construction site for example, if we view the data from a sample represented in a Particle Size Distribution (PSD, number of particles for each size fraction) everything above a certain TSS value is considered greatly exceeding the regulatory value and not of any further concern. Similarly, any value above a certain Turbidity (typically around 800NTU) is outside any values in the data and dismissed. Using an idealised case of a PSD (a virtual example shown below) the larger size particles (where a few large particles can exceed 40mgL-1 are simply considered beyond the regulatory value and of no concern (blue shaded area on image below). Similarly, elevated NTU is not of any concern once outside the possibilities of the TSS range being considered and is similarly dismissed (red shaded area on image below). This results in a limited consideration of TSS and NTU, which is appropriate for the context being used here but should not be used to consider TSS above the correlation presented or NTU values >1000 mgL-1, which is typically the limit of most site based measuring techniques.
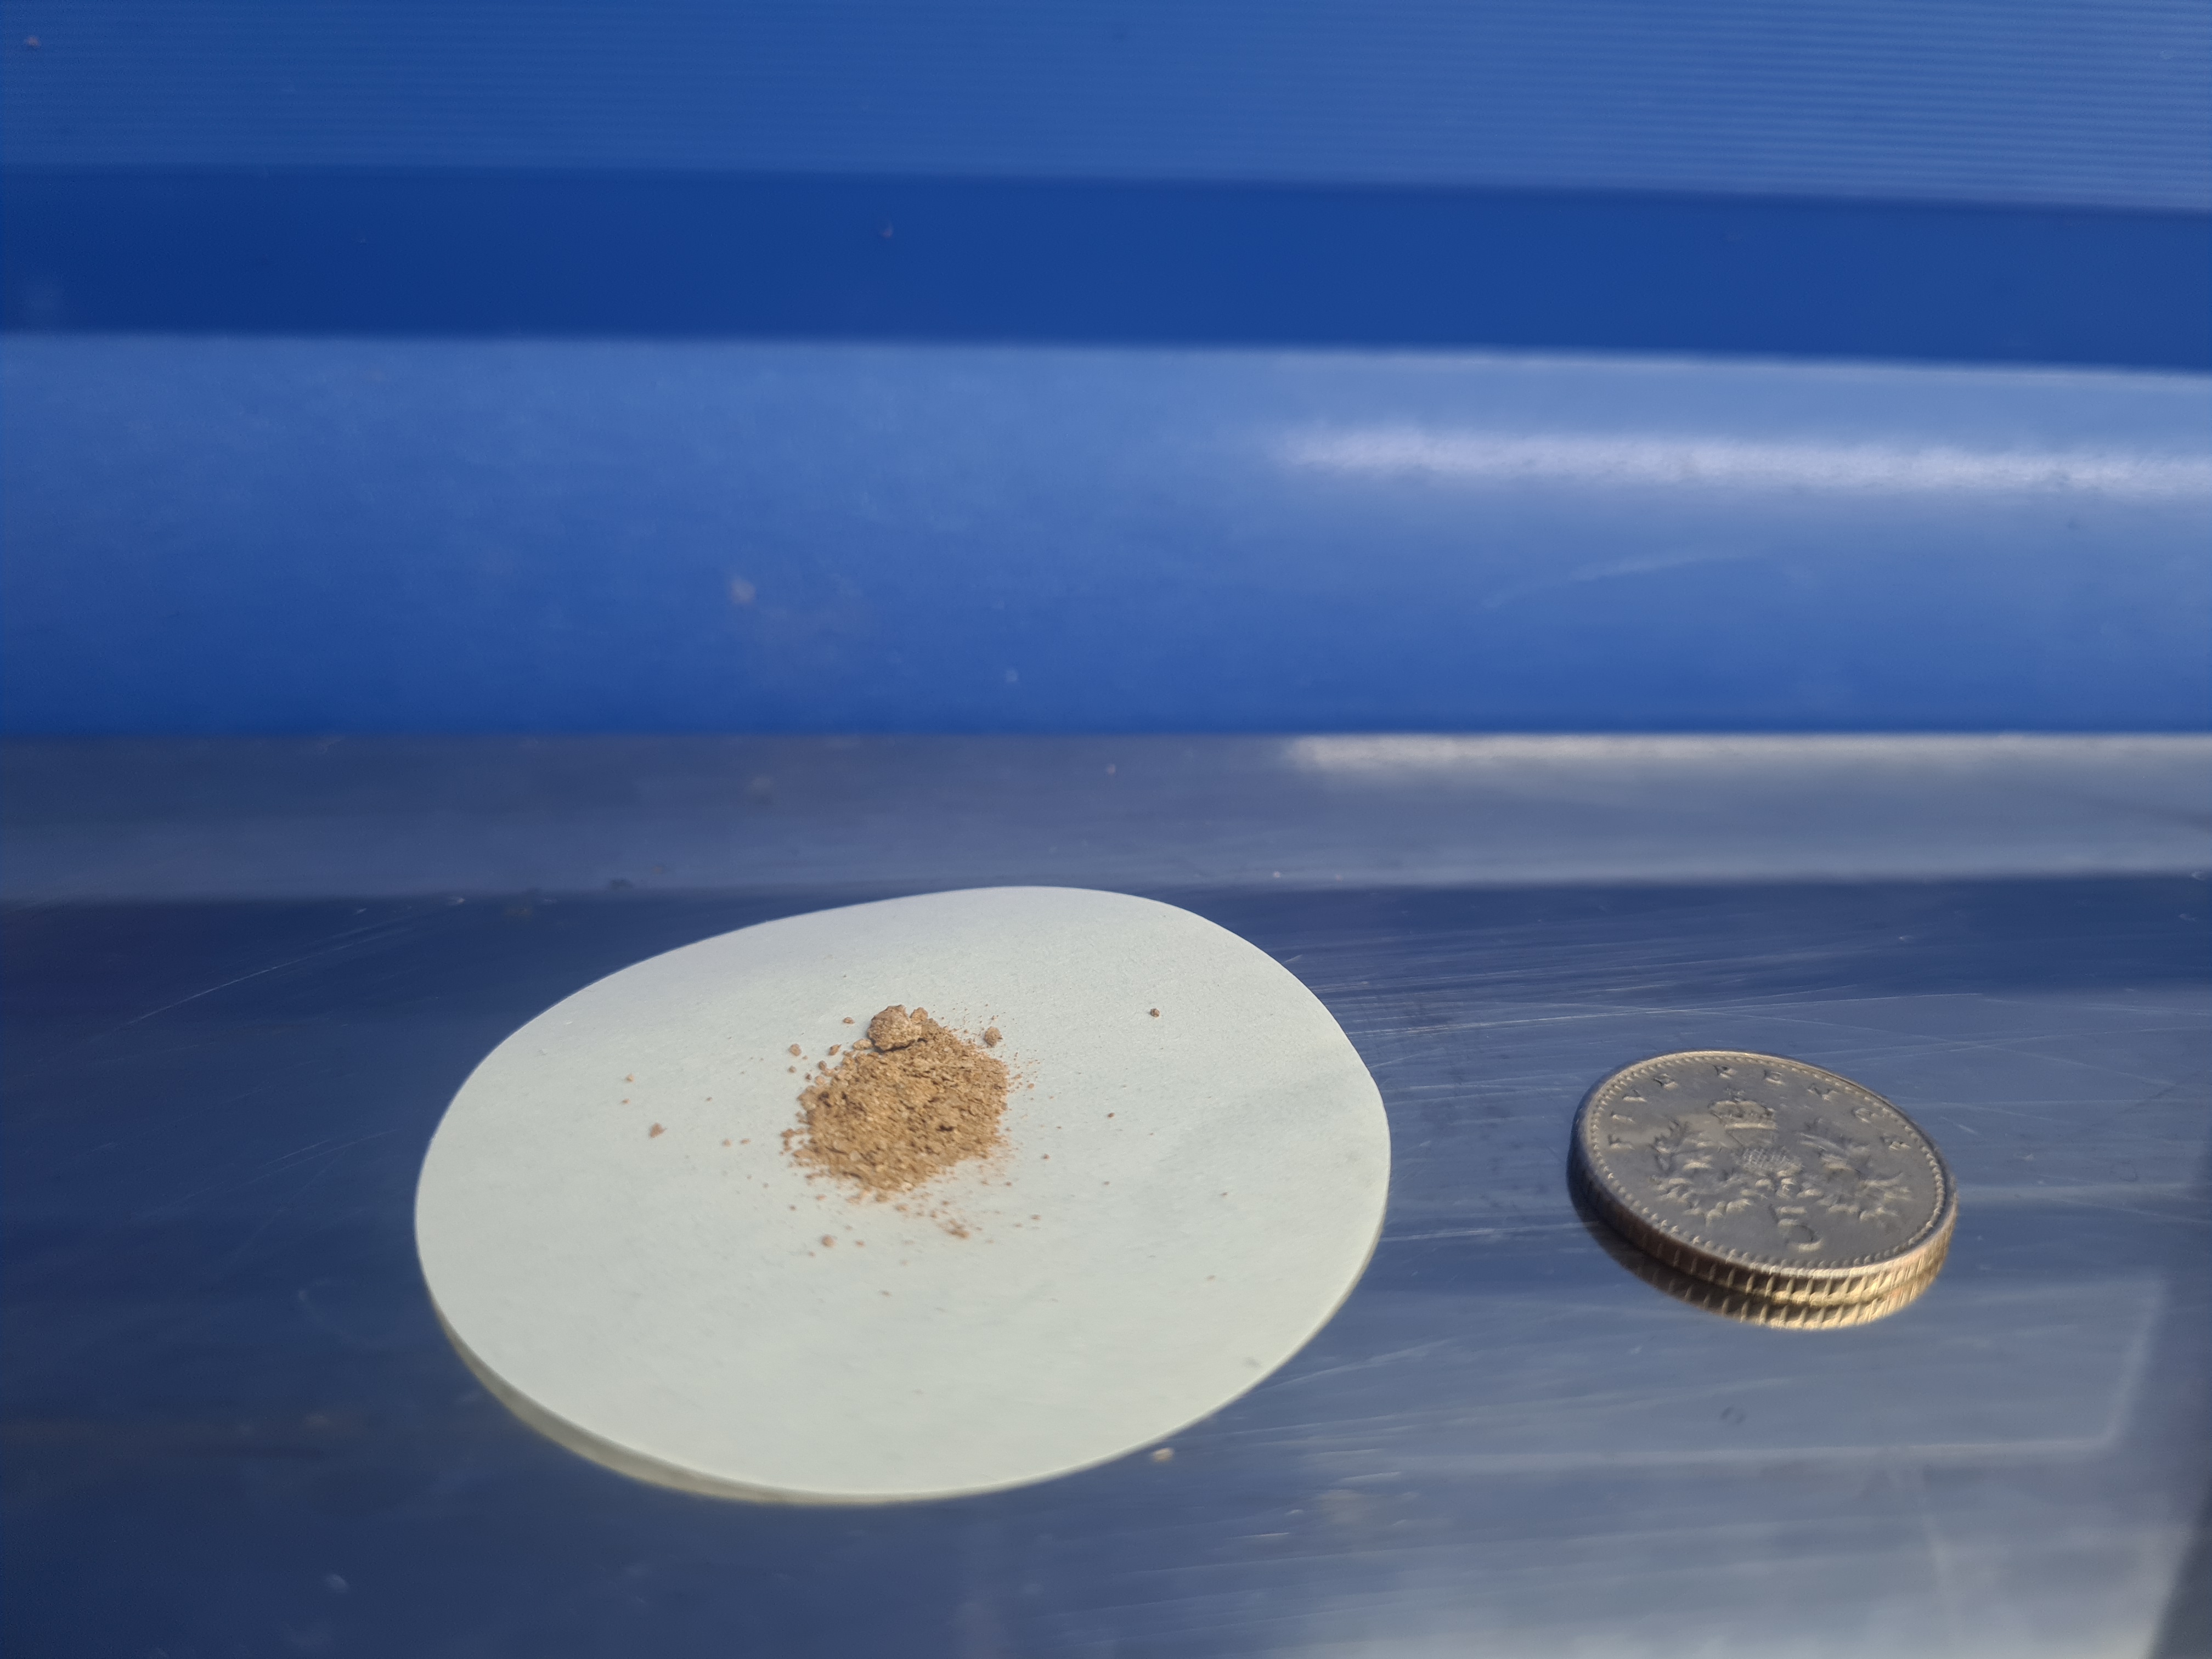
To provide context, the amount of silt-clay per litre of sample is very small. The image below shows 40mg from a sample, which would be the mass in a 1 Litre suspension for the generally defined on a surface water discharge permit. To give this context, the sludge type suspensions found around tracked vehicles or untreated in site ditches on construction sites are typically thousands of mgL-1.